Welcome back to Bree’s Mathematical Blog! Get ready for some mathematics fun! Today’s blog post is going to be a little different. I worked in a group to create a Three Act Play scenario for a future classroom. Visit the link below to explore my group’s Three Act Play!
Calculator Investigator
 Hello, and welcome back to Bree’s Mathematical Blog! Today we will be discussing some characteristics of calculator and why it is important for students to have access to them in classrooms. A calculator can be defined as, “also called calculating machine; a small electronic or mechanical device that performs calculations, requiring manual action for each individual operation” (Calculator, 2018). Calculators are somewhat of a debate in the Education world because, on one hand, teachers want their students to be familiar with the technology available to them, but students shouldn’t rely solely on technology, such as calculators. We will be discussing the history of calculators, the different types of calculators, and the pros of using calculators in the classroom.
History
The first tool for the use of mathematical computations was the abacus. “The abacus was a table of successive columns with beads or stones representing a single unit, which could be used for addition and subtraction” (The Calculator: A Brief History, 2017).  Other cultures such as the Chinese eventually refined this device to improve its dynamics. In 1642, the first true calculator was invented by Blaise Pascal. It performed calculations using a clockwork-type of mechanism. However, these calculators were very difficult to produce, therefore very few were made. Next, “Curt Herzstark invented the first handheld, mechanic calculator in 1945, from a design he had created in 1938. Shaped like a stout pepper grinder, the Curta calculators were produced in large quantities until 1970 when a company in Japan invented the first digital pocket calculator and the demand for the antiquated device faded” (The Calculator: A Brief History, 2017). Not only have calculators enhanced the ability to perform computations involved in everyday life, but it has provided people with the ability to understand mathematics on a greater scale.
Types of Calculators
Four-Function Calculator: Basic calculators can perform operations such as addition, subtraction, multiplication, and division. Students can use basic calculators for problems involving percentages and square roots. These calculators are suitable for primary school aged students because of their simplicity.

Basic calculator
Scientific Calculator: “By definition, a scientific calculator is a calculator designed to help you calculate science, engineering, and mathematics problems” (Alcocer). Modern scientific calculators have many more features than a standard four or five-function calculator. Scientific calculators allow students to work with various problems involving: trigonometry, pi, logarithms, and probability. Although I mentioned a few types of problems, those aren’t the only ones scientific calculators can be useful for. These can be used in mathematics classrooms at the junior high level all the way up to college and they are generally permitted or required on many standardized tests in subjects such as math and science.

Scientific calculator
Graphing Calculator: A graphing calculator is a handheld computer that is capable of plotting graphs, solving equations, and performing other tasks with variables. Some graphing calculators have a compute algebra system. These are typically called symbolic or CAS calculators. Graphing calculators are also a mathematical action technology. A mathematical action technology is defined as, “those that can perform mathematical tasks and/or respond to the user’s actions in mathematically defined ways” (Dick and Hollebrands, 2011, pp. xii). It allows students to examine multiple representations of functions and data. Graphing calculators are typically used in high school and college level mathematical courses.

Graphing calculator
Pros of calculators in the Classroom
We live in a society that is always changing thanks to the advancement of technology. Therefore, technology such as calculators is an important instrument that students will be able to use throughout their lives. “Computers and calculators were invented to save humans time and to allow us to solve more challenging problems more easily than we could do otherwise” (Steely, 2006). Another pro of calculators is that they are fast and accurate which is very convenient tool for students. For example, students can complete a set of problems and then check to see if their solutions are correct using a calculator. Calculators also allow students to have access to mathematical concepts and experiences from which they were previously limited with pencil and paper.
In conclusion, when students don’t have to worry about computation mistakes, they can focus on reasoning and problem solving. Teachers can also help students see patterns and solve complex problems. Even young students can use calculators to focus on the ideas behind computations rather than the act of calculating. The great thing about calculators is their only use isn’t just in the classroom. Everyone from physicists, to engineers, and architects make use of calculators such as the ones mentioned above. You have read over some of the history pertaining to calculators, the different types of calculators, and the pros in the classroom. Now it’s your turn! Do some research on the calculator that best fits your needs and goals and see what you come up with.

Resources
Alcocer, Y. Y. (n.d.). A Scientific Calculator. Retrieved November 25, 2018, from https://study.com/academy/lesson/what-is-a-scientific-calculator.html.
Calculator. (n.d.). Retrieved November 25, 2018, from https://www.dictionary.com/browse/calculator.
Dick, T., & Hollebrands, K.F. (Eds.) (2011). Focus in high school mathematics: Technology
to support reasoning and sense making. Reston, VA: National Council of Teachers of
Mathematics.
The Calculator: A Brief History. (2017, March 29). Retrieved November 25, 2018, from https://www.schoolmart.com/2017/03/29/the-calculator-a-brief-history/.
Steely, C. (2006, March). Technology Is a Tool. Retrieved November 25, 2018, from https://www.nctm.org/News-and-Calendar/Messages-from-the-President/Archive/Cathy-Seeley/Technology-Is-a-Tool/.
GeoGebra
It’s that time again to explore a new mathematical technology tool! Today we will explore a Geometry program called GeoGebra. ![]()
GeoGebra is a free mathematics program for all levels of education that includes geometry, algebra, tables, graphing, statistics, and calculus into one easy app/software (About GeoGebra). GeoGebra can be used to show simple geometric relationships to very complex geometric properties. It makes learning an abstract concept more meaningful, allows students to visualize related concepts and see how they affect each other, and builds student’s conceptual understanding. According to Principles to Action, “Interactive (dynamic) geometry applications allows exploration of geometric conjectures–including those in coordinate, transformational, and synthetic contexts–since dragging the objects preserves the underlying relationships among them in well-constructed diagrams” (National Council of Teachers of Mathematics [NCTM], 2014, pp. 78). Today’s exploration will include constructing and labeling figures and transforming figures. We will see how the use of GeoGebra builds student’s understanding in these explorations.
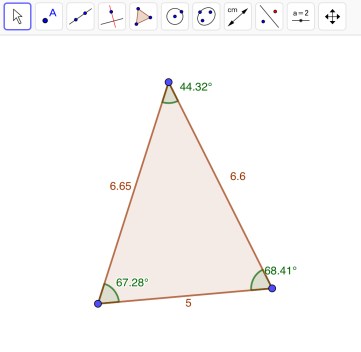
 We can use GeoGebra to create figures such as triangles, parallelograms, squares, rectangles, trapezoids, and kites. Although I have named several figures we can construct using GeoGebra, there are many more possible figures. “Constructing involves using the properties of the figure in its creation” (Dick & Hollebrands, 2011, pp. 33). Today, we will explore how to construct a few of these figures. Let’s start off with a triangle. Click on the “Polygon” tool and then click in 3 different places. View the image to the left. Once you have created your triangle, you can add in labels of angles and side lengths. To display the angle measures, click on the “Angle” tool. You will need to click on all of blue points. To display the length measures, click on the “Distance or Length” tool and then click on all the sides of the triangle. The image below includes all of the measures. There are many more features that can be displayed in GeoGebra, one example being the area of the triangle.
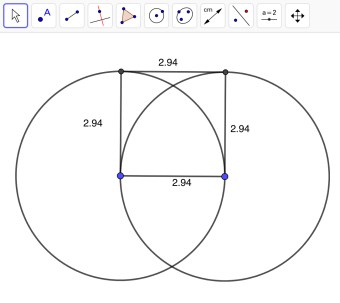
 Let’s construct a square. Start by constructing a circle. You can do this by clicking “Circle with Center through Point” and clicking in two different places. Construct another circle using the same tool by clicking the point on the right and then the center of the previous circle. View the image to the right. Next, click on the “Segment” tool and connect the two center points of the circles. Once you have done that, click on the “Perpendicular Line” tool and construct two perpendicular lines on either end of the line segment you previously created. You can do that by double tapping on the two center points of the circles. Once you have two perpendicular lines, you will need to connect them using a line segment at the top of both circles. When you have done that, you can hide the perpendicular line by holding the line and selecting “Show Object”. Connect all of the lines and you will have constructed a square. We can check to make sure all of the sides are the same by selecting the “Distance or Length” tool. View the square below. However, I want you to keep in mind, it is possible to construct these figures in more than one way.
When constructing figures, it is important for students to conduct drag tests to make sure the figures they have constructed is in fact correct. “Once a geometric object has been constructed, the geometrical relations that were used in its construction retain their integrity when the object is dragged” (Dick & Hollebrands, 2011, pp. 33). The task shouldn’t be about constructing a single figure, but rather creating a figure so that whenever a point is dragged, the figure will remain the same. The great part about using GeoGebra to construct these figures is how precise the program is. If the students were to construct this figure on paper, it will most likely not be exact. To explore more figures and step by step how to construct figures, click Introduction to GeoGebra.
 Technology such as GeoGebra “allows students to perform transformations with more accuracy, to explore their properties, and to consider what happens when two or more transformations are composed” (Dick & Hollebrands, 2011, pp. 41). Students discover important properties through their own investigations. Let’s go through a transformation called rotation. A rotation is a transformation where a figure turns around a fixed center point. In other words, the center of rotation is fixed and everything else on the plane rotates about that point. The first step of rotating a figure is constructing the figure. Click on the “Regular Polygon” tool and construct a square. Once you have your square, click on “Slider”. When the settings for the Slider come up, click on “Angle”. When you have the slider, click on “Rotate around Point”. When the menu for that pops up, type in what your slider is labeled. View the image on the left. The unlabeled square is the rotation you just made. You should end up being able to rotate your new figure using the slider. Even though I showed you how to construct one transformation, there are several more I encourage you to explore.
In conclusion, we have explored how to construct figures and how to perform a transformation. When students have the opportunity to use programs such as GeoGebra, they not only learn geometric concepts, but also build in-depth connections between the relationships. “Geometry, which is an area of mathematics that many describe as visual, would seem to lend itself naturally to technological tools that provide students with opportunities to create, view, and manipulate visual representations of geometrical objects” (Dick & Hollebrands, 2011, pp. 33). It also provides opportunities for students to explore problems that may have been more difficult otherwise. GeoGebra helps students think about behaviors they wouldn’t normally think of such as the drag test. For more information on the features of Geogebra, click here.
Resources
About GeoGebra. (n.d.). Retrieved October 27, 2018, from https://www.geogebra.org/about
Dick, T., & Hollebrands, K.F. (Eds.) (2011). Focus in high school mathematics: Technology
to support reasoning and sense making. Reston, VA: National Council of Teachers of
Mathematics.
National Council of Teachers of Mathematics. (2014). Principles to actions: Ensuring
mathematical success for all. Reston, VA: Author.
Des-Who? Desmos!
Desmos is a online advanced graphing calculator that allows users to explore mathematics in new and exciting ways. Did I mention that it’s FREE?

Desmos-Click for more information
It is an interactive calculator that permits students to alter their functions to see different graphs, and learn what each function looks like. New standards in mathematics promote students to have a deeper understanding of conceptual mathematics and how they can be applied in the real world. Incorporating technology is an essential component of building this comprehension. According to Focus in High School Mathematics, “Technology can be used to rapidly produce accurate examples and linked representations, creating venues in which students can better understand by hand-work and learn new methods to solve fundamental problems” (Dick & Hollebrands, pp. 19). In addition to graphing both equations and inequalities, it also features lists, plots, graph restrictions, piece-wise function graphing, polar function graphing, and etc. Desmos provides many benefits for students and teachers. A few of these benefits include sliders, tables, and Activity Builders.
Sliders
Students benefit from the ability to use sliders as substitutes for variables. They can visually watch how the variables manipulate the graph which helps build intuition and understanding of the way plots react to changes in values. For example, when Algebra students are learning about slope-intercept form, they can type y=mx+b into Desmos and add sliders to view how the slope and y-intercept affect the graph.

Tables
Desmos’ tables allow students to plot input and output data for any function. Students can organize ordered pairs, quickly plot points for functions, or run regressions to find a line to best fit. Using tables, students can graph groups of numbers at the same time. Tables can also be used for statistics, regressions, and scatter plots.

Activity Builder
 Desmos Activity Builder provides teachers with the tools to create online classroom activities. Teachers can build a series of screens that walk a student through interactive activities. Through these activities, teacher may ask students to graph or answer questions based on a graph. While students work through the activity, teachers can monitor student progress and understanding when viewing the dashboard. At any time the activity can also be paused to clear any misconceptions. Desmos also provides already made activities teachers can choose from at any time. Click here to view The Desmos Guide to Building Great Math Activites for more information on creating Desmos activities. Lastly, tips for teachers will pop up, giving helpful ways teachers can assist their students while they work.

Desmos’ Marbleslides Activity
The iPad app can function offline as well, so students don’t need internet access to make use of the powerful features. Desmos can also be used in many mathematical subjects such as Algebra, Calculus, and Statistics. “An excellent mathematics program integrates the use of mathematical tools and technology as essential resources to help students learn and make sense of mathematical ideas, reason mathematically, and communicate their mathematical thinking” (National Council of Teachers of Mathematics, 2014, pp. 78). Graphing applications can help students examine multiple representations by generating graphs, tables, and symbolic expressions that are dynamically linked. Demos does a fantastic job helping students make sense of ideas and reason mathematically through using the sliders and table features. Desmos’ Building Activities also allow students to communicate their mathematical thinking while teachers monitor student understanding. Once again, sliders, tables, and Building Activities are only a few of the fantastic features of Desmos.
I highly recommend exploring Desmos some more.
Resources
Dick, T., & Hollebrands, K.F. (Eds.) (2011). Focus in high school mathematics: Technology to support reasoning and sense making. Reston, VA: National Council of Teachers of Mathematics.
National Council of Teachers of Mathematics. (2014). Principles to actions: Ensuring mathematical success for all. Reston, VA: Author

Spreading Spreadsheets, One at a Time
Numbers App
Spreadsheet allow students to “get their hands dirty” when incorporated into classroom lessons. Principles to Actions states, “An excellent mathematics program integrates the use of mathematical tools and technology as essential resources to help students learn and make sense of mathematical ideas, reason mathematically, and communicate their mathematical thinking” (National Council of Teachers of Mathematics, 2018). Thus, spreadsheets promote abstract and complex models by providing real world examples students can analyze. They also provide quick results for complicated calculations and generate tables of values that promote insights into mathematical relationships and structures.
Spreadsheets are easy to implement into classrooms because it is a program students typically already have on their devices. It is an attractive technology that can be used in future projects, careers, and in students’ personal lives. Better yet, spreadsheets are relatively easy to use and are flexible. “Recently, spreadsheets have been developed that support computer algebra, making it possible to have symbolic computations in cells based on the symbolic content of other cells” (Dick & Hollebrands, 2011). Using a program such as spreadsheets forces students to think deeply using their own methods. Also, spreadsheets provide three main functions students can examine: exploring graphs, recording data, and grading organization.
Exploring Graphs
Students can collect data and use charts to create graphs. Their graphs can be easily shared and critiqued with fellow classmates. Graphs can be used to show relationships between numbers in a line, bar, and pie chart. Visualizing data, such as graphs, can help students gain better understanding of the data they are analyzing. Below is an example of a graph from a spreadsheet.

Recording Data
Spreadsheets are helpful for real world applications such as personal living expenses and budgeting. Information can be easily placed in columns and rows neatly. Spreadsheets are also beneficial when students work with repetitive calculations. For example, the Numbers App has an option where, when students plug in a formula, they can auto-fill all the way down, that way they aren’t wasting time filling formulas in every cell.

Grading Organization
Students can record data such as homework, assignments and exam scores to keep up with their grades on their own. Teachers are constantly being hassled by their students when it comes to grades. By using a spreadsheet, students can view their progress any time they feel. When they can see their grades, it helps to motivate them to do better if for example, they get a bad grade. They can easily calculate what they need to do to be able to keep that letter grade they are striving to get.
“Technology is an inescapable fact of life in the world in which we live and should be embraced as a powerful tool for doing mathematics. Using technology can assist students in visualizing and understanding important mathematical concepts and support students’ mathematical reasoning and problem solving” (National Council of Teachers of Mathematics, 2014). Spreadsheets are a great example where students can gain better understanding and examine real world problems while exploring graphs, recording data and organizing their grades.
Resources
Dick, T., & Hollebrands, K.F. (Eds.) (2011). Focus in high school mathematics: Technology to support reasoning and sense making. Reston, VA: National Council of Teachers of Mathematics.
National Council of Teachers of Mathematics. (2014). Principles to actions: Ensuring mathematical success for all. Reston, VA: Author.

The Ins and Outs of Wolfram Alpha
![]() Wolfram Alpha can be defined as a “fundamentally new paradigm for getting knowledge and answers—not by searching the web, but by doing dynamic computations based on a vast collection of built-in data, algorithms and methods” (About Wolfram Alpha). When this program is compared to others, it stands out in many ways. If you need specific information or need help computing a complicated calculation, it is a convenient technology tool. Many school systems are slowly starting to use this computer program during every day lessons. With any computer program, there are pros and cons.
Wolfram Alpha can be defined as a “fundamentally new paradigm for getting knowledge and answers—not by searching the web, but by doing dynamic computations based on a vast collection of built-in data, algorithms and methods” (About Wolfram Alpha). When this program is compared to others, it stands out in many ways. If you need specific information or need help computing a complicated calculation, it is a convenient technology tool. Many school systems are slowly starting to use this computer program during every day lessons. With any computer program, there are pros and cons.
The first pro I will discuss is how Wolfram Alpha caters to students with different learning styles. For example, if you search a function in the browser, the graph will pop up along with alternate forms, roots, properties as a real function and more. It allows students who are visual learners be able to see the graph and interpret the function from that point of view.  Another pro would be how Wolfram Alpha is a proficient and accurate technology tool. It is a reliable source without having to waste valuable time searching Google. As stated in Focus in High School Mathematics: Technology to Support Reasoning and Sense Making, action technologies such as Wolfram Alpha promote good management skills such as analyzing problems, implementing strategies, seeking and using connections, and reflecting on a solution to a problem (Dick & Hollebrands, 2011).
Although Wolfram Alpha has had so many positive reactions from schools and teachers, there are some who would argue it could potentially encourage students to take the easy way out of doing assignments and homework. It is convenient to just look up the solutions to problems instead of attempting them on your own. As future teachers, we are constantly reminded how students should be learning how to problem solve and understand concepts, but with an easy distraction at the tips of their fingers, Wolfram Alpha can be a downfall. These cons can be minimized by introducing Wolfram Alpha into a lesson once students have a better understanding of the topic. Another way would be when giving test, give half of the test without any resources such as Wolfram Alpha and half using the program. That way, this technology tool helps students “make sense of mathematical ideas, reason mathematically, and communicate their mathematical thinking” (National Council of Teachers of Mathematics, 2014).
Principles to Action states too many teachers have limited access to materials, tools, and technology needed for students to focus on learning procedures with concentration on meaning and understanding (National Council of Teachers of Mathematics, 2014). With a technology tool such as Wolfram Alpha, it caters to diverse learning styles, promotes better understanding and is a reliable source for students.
References
Dick, T., & Hollebrands, K.F. (Eds.) (2011). Focus in high school mathematics: Technology to support reasoning and sense making. Reston, VA: National Council of Teachers of Mathematics.
National Council of Teachers of Mathematics. (2014). Principles to actions: Ensuring mathematical success for all. Reston, VA: Author.
About Wolfram Alpha. (n.d.). Retrieved from http://m.wolframalpha.com/

About
Name’s Bryanna Michalak and I am currently a Senior at Auburn University. As you can probably already guess I am a Secondary Mathematics Education major. I currently reside in Alabama but I am originally from Connecticut. Yeah, I know, a northerner. I get that a lot. I’m stoked to be able to share my passion for teaching math with all of you fantastic followers. I am the youngest of 4 children and the only girl. I enjoy fishing, reading, and going to zoo’s.
Welcome!
Thanks for joining me! I am really excited about sharing with you one of my favorite topics–mathematics! Although one of the most unliked subject, I plan on showing you just how joyful it can really be. So sit back, and enjoy the ride.
Good company in a journey makes the way seem shorter. — Izaak Walton

