Choose Your Allowance: Your parents finally agree to provide you with a monthly allowance, with the amount of your allowance increasing each month if you keep your grades up. But they decide to give you a choice of three plans:
 Since the first question tells you to set up a spreadsheet, I decided the Numbers App would be the most beneficial tool for this mathematical problem. It helps with organization and is very easy to use. First, I began by opening the Numbers app on an ipad and creating a new spreadsheet. I created the first column, Months, beginning with 0. In the next cell I typed in the cell before it (cell A2) and added 1 to it. I proceeded to auto fill all the way to month 30. The image to the left shows the recursive formula used to auto fill the month column. Let me take a moment and explain what recursive means. It is defined as “having an initial value and using the preceding term to define the next term of the sequence” (Krebs).
Plan A: Start with $20 allowance and get a $1 raise each month (assuming good grades in school).
 This plan says beginning at month 0, your parents give you an initial amount of $20, given you are keeping up with your grades sufficiently. I begin my spreadsheet by labeling the next available column “Plan A”. In the first cell, I entered the initial amount of $20. Since the plan says the allowance is increasing $1 each month, in the next cell I used a recursive formula of A2 + 1, to get the next value of $21 for month 1. The picture on the right depicts the recursive formula. Analyzing Plan A, I realized the pattern is increasing at a constant rate, which is the definition of a linear function, therefore it’s linear. The closed formula for a linear function is y = initial amount + the difference×(month). That is, in the case of Plan A, the closed formula (image below) is y=$1n+$20, since $20 is the initial value and $1 is the difference. If you were to graph this, the line would be straight line with a slope of 1 and a y-intercept of 20. Continue scrolling to question #2 to view the graph.

Plan B: Start with a $15 allowance. Your first raise is $0.25, and each month your raise increases by $0.25 (again assuming good grades).
 When I originally looked at this plan, I was honestly a little intimidated by what it was asking. But with some perseverance, I stuck it through until the end. Let us begin. I started by analyzing “your first raise is $0.25, and each month it increases by $0.25”. What this says is, after your initial value of $15 month 0, month 1 will increase by $0.25, thus becoming $15.25. Now here’s where most people will get confused, after the first raise of $0.25, the next raise is adding $0.25 to the previous one. I found creating a Raise column to be very beneficial. In your first cell, start with $0.25. The next cell will be $0.25 plus the previous cell. Refer to image on the left. Once again, this uses a recursive formula.
 Since including the Raise column, the recursive formula for Plan B is very simple. The initial value for month 0 is $15 (given in the instructions). The next cell is going to be the initial value plus the first raise. The recursive formula is $0.25n+a_(n-1). An easier way of writing this is the previous amount plus the corresponding raise for that row. See the image on the right. I noticed this plan is growing at a linear rate of change with a first initial difference of $0.25 and a second difference of $0.25, thus making this a quadratic function. The general closed formula for a quadratic function is second difference× n× (n-1)/2 + initial first raise × n+ initial amount. That being said, the closed formula (image below) will be:
 ![]() . When you look at the image you will see some cells with dollar signs with it. That is to lock in that specific cell. Once again, when you graph this function you will get a parabola. Scroll to question #2 to view image.
. When you look at the image you will see some cells with dollar signs with it. That is to lock in that specific cell. Once again, when you graph this function you will get a parabola. Scroll to question #2 to view image.

Plan C: Start with a $10 allowance and get a 10% raise each month (with good grades).
 Compared to Plan B, this plan will be a breeze. I began month 0 with $10. The recursive formula is going to be a_(n-1)×1.1 because you’re using the previous term and you have to multiple it by the percentage which in this case is 10%. We do the percentage as 1.1 in the formula because it is easier to say that instead of multiplying 10% by the previous term and adding it to that same previous term. Auto-fill all the way down. As you analyze this plan, the goal is for you to notice this is an exponential function. Each month, you are multiplying 10%. Therefore, your closed formula should be
 ![]() . To view a visual representation of an exponential function and its graph, scroll down to question #2.
. To view a visual representation of an exponential function and its graph, scroll down to question #2.

Question #1: Which allowance plan would you choose? Set up a spreadsheet to help you answer the question.

On a happy note, you already have half of this question done with your spreadsheet. This question relies on how long you plan on wanting an allowance. If, for example, you are a senior in high school and are about to move out in let’s say a year, the best plan to choose would be Plan B. However, if you planned on sticking with it for the long road, Plan C is the best plan for you. Lastly, let’s say you only want an allowance for 4 months, then Plan A is the best plan for you. Once again, it’s dependent on how long you want an allowance for.
Question #2: What does this imply about the relative growth rates of different kinds of functions?
This problem implies that different functions grow at different rates. Plan A grows at a constant rate, Plan B grows at a faster rate than Plan A, and Plan C grows the fastest compared to both A and B.
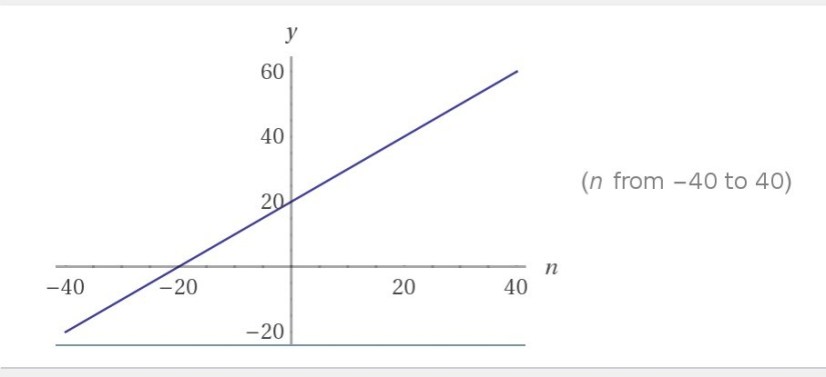
Plan A-Linear

Plan B-Quadratic

Plan C-Exponential
These graphs were taken from the app, WolframAlpha.
Return to Introduction
Continue to Teacher Discussion
